Using KNN Algorithm to analyze and classify Heart Failure Data


The term 'Heart Failure' does not mean that the heart has stopped; rather it is a condition when the heart muscles cannot pump enough blood and oxygen needed by the body. Unlike to what some might believe it is not always fatal and if diagnosed and treated early, patients with heart failures can lead a long life. Treatment usually involves medication, daily physical activity and reduction of salt in patient's daily diet. Patients must also monitor their body weight and symptoms and have regular consultations with their doctor.
In this article we analyze a dataset of heart failure patients and design a data model that would be able to predict whether a heart failure patient is going to survive for a certain number of days post diagnosis. The data model will try to classify whether a patient based on blood test results and some other factors, is likely to die (or not) within a specific period (in days) after the ‘heart failure’ diagnosis. For this Classification problem, we will use the K-Nearest Neighbor Classifier
We will be using Python for designing the model and make use of the Scikit-learn library for python
1. Classification and Classifier
According to Wikipedia, classification is the problem of identifying which of a set of categories (sub-populations) an observation (or observations) belongs to. For example, in our case assigning a Death Event (Yes/No) to the patient based on some observed characteristic like blood test results, age, gender, etc.
A Classifier on the other hand, is an algorithm that provides a concrete implementation of to classify or map input data to a category. In this article we will use the K-Nearest Neighbors (KNN) Classifier to categorize (or predict) the Death Event of the patient
2. The K-Nearest Neighbors Algorithm
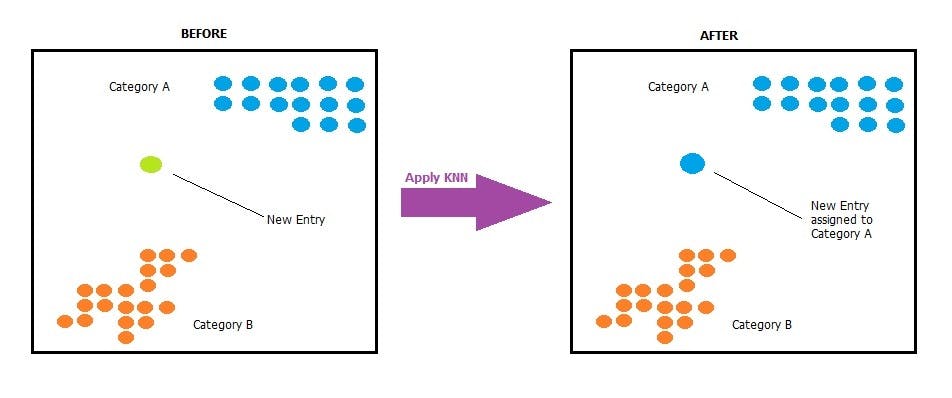
Suppose we have two categories of data points – Category A and Category B and we have a new data point. We need to figure into which one of these two categories this new data point will belong to. To solve this type of problem we use the K-Nearest Neighbors Algorithm
 Suppose we have two categories of data points – Category A and Category B and we have a new data point. We need to figure into which one of these two categories this new data point will belong to. To solve this type of problem we use the K-Nearest Neighbors Algorithm
The KNN Algorithm involves the below steps
2.1. Load the dataset
2.2. Select a value of K i.e., the number of nearest neighbors
2.3. For predicting the class for any test data performs the following steps:
Compute the distance between the test data from each data point in the training data. We could use the Euclidean distance between the test data with each of the training points: The Euclidean distance between two points A(X₁,Y₁) and B(X₂,Y₂) can be calculated as below:
Euclidean distance between A and B = √ ((X₁-X₂)² + (Y₁-Y₂)²)
Sort the computed distances in ascending order
Select the top K rows from these sorted rows
Get the most frequent class of these rows
Predict the class
3. The Heart Failure Dataset
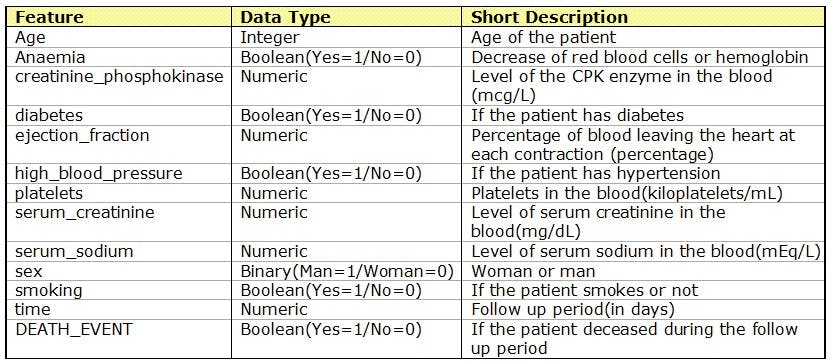
The dataset used in this article consists of 239 records. Each observation in the dataset contains information about whether the heart failure patients had died before the follow-up period indicated by the "time" column in the data set. Thus, "DEATH_EVENT"=0 does not mean that the patient did not die, only that the patient had not died by the time of the follow-up. The dataset can be downloaded from here
Following is the list of all features in the dataset:
4. Python Implementation
The python implementation will include the following steps:
- Import the required Packages and Classes
- Read the Dataset into a Dataframe
- Split the Data into mutually exclusive training set and test set
- Select an optimal value for K i.e., the number of nearest neighbors using the training and test set.
- Fit a model using the entire dataset and the value of K selected as above
- Use the model to predict new/unknown values of the target variable (DEATH_EVENT)
4.1 Import the required libraries
We will be using the following packages:
pandas: It is a software library written for data manipulation and analysis for Python. We would be using the read_csv function from pandas to load the data into a data frame
numpy: It is a library written for python for providing support for arrays, matrices and a large number of mathematical functions to operate on these arrays. We would be using the asanyarray function to convert inputs into ndarray objects
matplotlib: It is a plotting library for Python. We would be using the pyplot interface from matplotlib to generate a plot of the accuracy of the data model for different choices of K-values (for the given dataset)
sklearn: It is a machine learning library for the Python programming language.We would be using the sklearn.model_selection.train_test_split function to split the data into training set and test set. We would be using the sklearn.neighbors.KNeighborsClassifier class to fit the model using the KNN Algorithm. We would be using the slkearn.metrics.accuracy_score function to evaluate the data model.
Following is the python code to import the required libraries and classes
import numpy as np
import pandas as pd
import matplotlib.pyplot as plt
from sklearn.model_selection import train_test_split
from sklearn.neighbors import KNeighborsClassifier
from sklearn import metrics
4.2 Read the data into a DataFrame
After importing the required libraries, we would be using the read_csv function from pandas to read the entire data into DataFrame using the below code:
data=pd.read_csv("heart_failure_clinical_records_dataset.csv")
4.3 Split the data into mutually exclusive training set and test set
The next step would be to split the data into training set and test set using the train_test_split function so that 75% of all rows are randomly selected to form the training data while the remaining 25% of rows will be used for evaluating the model. This split is achieved using the following code:
train_data,test_data = train_test_split(data,test_size=0.25,random_state=1)
In this article we would be treating the DEATH_EVENT Column as the target (Y) and all remaining columns as features (X) that would be used for designing a model for predicting the value of DEATH_EVENT.
train_X = train_data.iloc[:,train_data.columns !='DEATH_EVENT']
train_Y = train_data.iloc[:,train_data.columns =='DEATH_EVENT']
test_X = test_data.iloc[:,test_data.columns !='DEATH_EVENT']
test_Y = test_data.iloc[:,test_data.columns =='DEATH_EVENT']
4.4 Select an optimal value for K
For selecting the optimal value for K or the number of nearest neighbor, we initially try to fit model to the training data using different values of K (from 1 to 20) . We would be using the sklearn.neighbors.KNearestNeighboursClassifier class to fit the model, For each fitted model, we evaluate and plot the accuracy score of the fit against the value of K using matplotlib.pyplot.plot function as below:
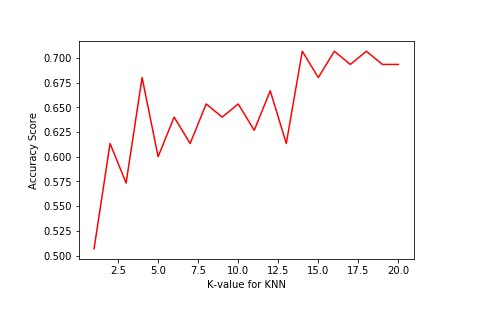
From the plot we observe that the best accuracy score achieved is around 0.7 and the lowest value of K for which this is achieved is 14. So in this case we accept K=14 as our choice of the number of nearest neighbors.
Following is the python code for finding the optimal value for K:
knn_neighbors = range(1,21)
nptrain_Y = np.asanyarray(train_Y[['DEATH_EVENT']])
accuracy_scores=[]
for i in knn_neighbors:
    knn = KNeighborsClassifier(n_neighbors=i)
    knn.fit(train_X,nptrain_Y.ravel())
    predicted_Y = knn.predict(test_X)
    accuracy_scores.append( metrics.accuracy_score(test_Y,predicted_Y))

plt.plot(knn_neighbors,accuracy_scores,color="red")
plt.xlabel('K-value for KNN')
plt.ylabel('Accuracy Score')
4.5 Fit the Model using the optimal value of K
After selecting K=14, we now fit the final model to the entire dataset (not just the training set) using this value and the below python code. We would be using this model to make predictions:
all_X = data.iloc[:,data.columns !='DEATH_EVENT']
all_Y = data.iloc[:,data.columns =='DEATH_EVENT']
npall_Y = np.asanyarray(all_Y[['DEATH_EVENT']])
knn_opt = KNeighborsClassifier(n_neighbors=14)
knn_opt.fit(all_X,npall_Y.ravel())
4.6 Making Predictions with the model
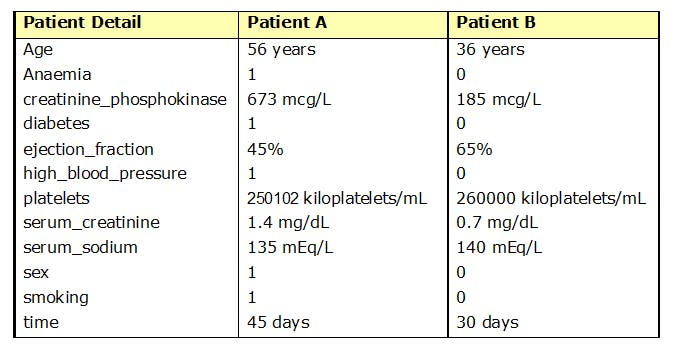
Suppose we have two patients (patient A and patient B) diagnosed with heart failure. We have the following detail about these patients and want to use the model to predict whether
- patient A is likely to Die within 45 days post diagnosis
- patient B is likely to Die within 30 days post diagnosis
We will use the following python code to feed the above data to the model and generate a prediction of the DEATH EVENT
patient_detail =[[56,1,673,1,45,1,25102,1.4,135,1,1,45],
                 [36,0,185,0,65,0,260000,0.7,140,0,0,35]]

predicted_death_event = knn_opt.predict(patient_detail)

print(f"\nDeath Event-> 0:No ; 1:Yes")
print(f"\nPredicted Death Event for Patient A: {predicted_death_event[0]}")
print(f"\nPredicted Death Event for Patient B: {predicted_death_event[1]}")
On executing the above code we get the following output:
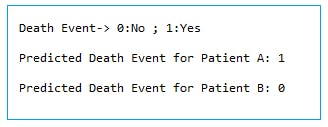
From above we observe that:
The predicted output for Patient A is 1 meaning that the model predicts that this patient is likely to die within 45 days post diagnosis
The predicted output for Patient B is 0 meaning that the model predicts that this patient is likely to survive at least 30 days after the diagnosis
In this way, given the patient details (including blood parameters) we can use the model to predict the patient's Death Event post diagnosis.